
Blog · Buyer guide
Huntington Harbour Waterfront Sales Statistics, Explained
How to read waterfront sales numbers in Huntington Harbour without being misled by averages, price per foot, or thin sample sizes.
October 10, 2026 · 11 min read
By Craig Ratowsky, Principal agent, Ratowsky Group at Compass
How should you read Huntington Harbour waterfront sales statistics?
Huntington Harbour waterfront sales statistics in Huntington Beach track volume, days on market, and price premiums. Because annual sales are thin, treat each figure as illustrative, not a fixed rule.
What do waterfront sales statistics actually measure?
Waterfront sales statistics are a summary of closed transactions over a window of time. The common numbers are the count of sales, the median or average sale price, the median days on market, the sale-to-list price ratio, and the price per square foot. Each one answers a narrow question, and none of them tells the whole story on its own.
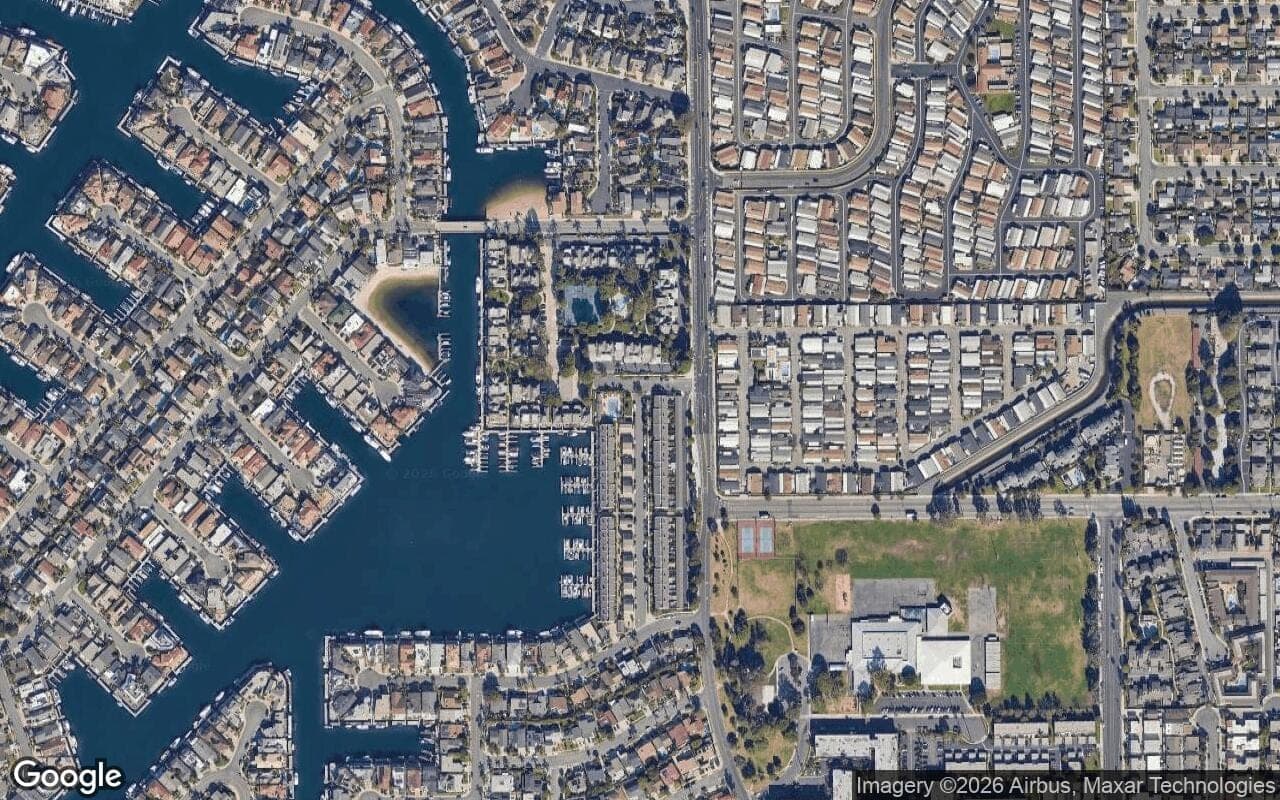
In Huntington Harbour, the catch is sample size. This is a small slice of the Huntington Beach market, spread across Trinidad, Davenport, Gilbert, Humboldt, and Admiralty islands plus the mainland harbour frontage. A handful of sales in a quarter can swing an average by hundreds of thousands of dollars, so a chart that looks dramatic may just be reflecting which homes happened to close.
The right way to use these numbers is as a starting point for questions, not as a verdict. When you see a figure, ask what it counts, over what period, and how many sales sit behind it. Craig and Justin Ratowsky build pricing conversations around that context rather than a single headline number, and you can start one through the contact page.
How much do waterfront homes sell for in Huntington Harbour?
Waterfront prices in Huntington Harbour span a wide band because the product itself varies so much. A channel-front townhome, a single-family home on a short dock, and a point-lot estate with wide water frontage are all technically waterfront, and they can sit several million dollars apart. Any single average blends those into one number that may not match a single real home.
Treat published price ranges as illustrative and updatable rather than fixed. The honest framing is a range with context attached: the home's island, its water frontage, dock length, condition, and whether it faces a main channel or a quiet turning basin. Those variables move price more than the raw square footage does.
For current closed ranges by island and home type, the Huntington Harbour community overview and the broader market updates are better anchors than a screenshot of a single month. If you want a specific read on a given address, a direct valuation through the home value tool and a follow-up conversation will beat any portal estimate.
What premium do dock and waterfront homes command over inland homes?
Waterfront and dock homes generally carry a meaningful premium over comparable inland homes in the same ZIP code, 92649. That premium exists because the water access, the dock, and the view are scarce and cannot be reproduced on an inland lot. How large the premium runs depends on the specific home, so any percentage you see quoted should be read as illustrative, not a guaranteed multiplier.
Part of what drives the gap is simple supply. There are only so many waterfront parcels in the harbour, and no one is building more water frontage. When demand is steady and inventory is thin, the premium holds up; when several waterfront homes list at once, buyers get more choice and the spread can narrow.
The premium is also not uniform across the water. A home with a long, usable dock that berths a larger vessel is valued differently than a home with a short dock or shared access. To see how frontage and dock capacity change the math, the waterfront homes guide walks through the logistics in more detail.
Why does price per square foot mislead on waterfront properties?
Price per square foot is a useful shorthand for inland tract homes where lots and finishes are similar. On the water it breaks down, because a large share of a waterfront home's value is not inside the walls. The dock, the water frontage, the view corridor, and the lot shape carry value that never shows up in the interior square footage.
Picture two homes of the same size on the same island. One sits on a point lot with wide frontage and a long dock; the other backs a narrow channel with a short dock. They can close at very different prices while reporting similar square footage, which produces wildly different price-per-foot figures. Neither number is wrong, but using one to price the other would be.
Smaller waterfront homes also tend to show a higher price per foot than larger ones, because the land and water components are spread across fewer interior feet. That is why a tiny channel-front home can post a price per foot that looks alarming next to a big estate. Read price per foot as one input, then weight the lot, the frontage, and the dock separately.
How does low sales volume create year-to-year variance?
Thin volume is the single biggest reason waterfront statistics jump around. Huntington Harbour produces a limited number of waterfront closings in a given year, so each sale carries real weight in the averages. One trophy sale or one deeply discounted fixer can tilt a quarterly median in a way that has nothing to do with the broader direction of the market.
This is a classic small-sample problem. With inland neighborhoods, dozens or hundreds of sales smooth out the noise. On the water, you may be looking at a sample small enough that a single transaction is a visible percentage of the data, which is why month-to-month charts can look volatile even in a stable market.
The practical fix is to widen the window and segment the data. Looking at trailing twelve-month figures, and separating by island or home type, gives a steadier picture than a single month. The Huntington Beach market page is set up for that longer view, and a conversation with the Ratowsky Group can add the context a chart cannot.
How do dock length and water frontage change the numbers?
Water frontage, measured as the linear feet of a lot that touch the water, is one of the strongest value drivers in the harbour. More frontage usually means a longer dock, better views, and a larger buildable envelope with a true waterfront orientation. It is also far more influential than interior square footage, which is exactly why price per foot misfires on these homes.
Dock capacity matters alongside frontage. A dock that can berth a larger vessel, or more than one, serves a different buyer than a short dock with limited draft. Permitted dock size, the condition of the dock and seawall, and tidal considerations all feed into value, and they are worth verifying during escrow rather than assuming from a listing photo.
Because frontage and square footage pull in different directions, comparing homes on frontage first often tells you more than comparing on size. The waterfront homes guide covers seawalls, docks, and inspection points, and the luxury page shows how the higher end of the harbour tends to be positioned.
Is there a seasonal pattern to waterfront sales in Huntington Beach?
Residential real estate in Orange County tends to follow a seasonal rhythm, with more listings and activity in spring and early summer and a quieter stretch in late fall and the holidays. Waterfront activity in Huntington Harbour broadly tracks that pattern, since the water and the boating lifestyle show best in warm, clear weather.
That said, seasonality is harder to read on the water precisely because of the thin volume discussed above. A slow summer with few listings or a busy January driven by one or two sales can scramble the seasonal signal. A single quarter is rarely enough to confirm a pattern on such a small data set.
For sellers, timing a waterfront launch is less about chasing a calendar rule and more about inventory, demand, and how your specific home presents. The sellers page outlines how the Ratowsky Group approaches launch strategy, and a timing conversation can weigh your home against what is currently active.
Where does the waterfront sales data come from?
Different sources count sales differently, which is one more reason two reports can disagree. Portal estimates, MLS-based reports, and association data each have their own geography, timing, and definitions of what counts as a sale. Knowing the source helps you understand why a number looks the way it does.
Here are the main places waterfront sales figures originate, and what each is good for:
- The local MLS, which records closed sales with the most granular detail on dock, frontage, and home features. This is the backbone of any serious waterfront comp set.
- The California Association of Realtors, which publishes county and statewide trend data useful for the broader Orange County backdrop.
- The National Association of Realtors, which reports national and regional existing-home sales context.
- Redfin and similar portals, which aggregate recent sales and are convenient for a quick look, though their neighborhood boundaries and estimates can differ from MLS reality.
- The Ratowsky Group's own closed harbour transactions, which add island-level and dock-level context that broad reports miss.
How can you tell a real comp from a misleading one?
A good waterfront comp matches on the things that drive waterfront value, not just on bedroom count and square footage. The goal is to compare homes that would appeal to the same buyer for the same reasons. A few filters separate a useful comparison from a distracting one.
Run a candidate comp through these questions before you trust it:
- Is it on the water the same way? A main-channel home and a cul-de-sac channel home are different products.
- Does the frontage match? Compare linear water frontage first, then square footage.
- Is the dock comparable in length, condition, and permitted capacity?
- Is the orientation and view similar, including sun exposure and privacy from neighboring docks?
- Was it an arm's-length, fully exposed sale, or an off-market or distressed deal that may not reflect open-market value?
- How recent is it? In a thin market, a sale from a year ago may predate a real shift in pricing.
- Did it involve pre-sale preparation or staging that changed how it showed, which can move the final number?
What does the Seascape sale show about reading waterfront numbers?
A single documented sale illustrates why averages and automated estimates deserve caution on the water. The Ratowsky Group's sale at 3801 Seascape Drive on Trinidad Island carried an automated estimate of roughly $2.45M and closed well above it, drawing 12 offers, 8 of them all cash, in 8 days on market, about $643,000 over the asking price.
The lesson is not that every waterfront home beats its estimate by that margin. The lesson is that an algorithm leaning on square footage and generic comps can miss what a specific waterfront home is worth to real buyers competing for it. Presentation, launch strategy, and genuine demand all moved that result beyond what a model predicted.
That gap between estimate and outcome is exactly why the Ratowsky Group treats portal figures as a starting point and prices from current, like-for-like waterfront comps instead.
How should you use these statistics for your own move?
If you are researching Huntington Harbour as a buyer, use the statistics to understand ranges and pace, then verify any specific home on its own merits: frontage, dock, condition, and orientation. The buyers page explains how the Ratowsky Group approaches a waterfront search, and the waterfront homes guide covers the inspection items that matter most on the water.
If you are a seller, resist pricing off a portal estimate or a blended neighborhood average. A waterfront home should be priced against recent, closely matched waterfront sales, with your frontage and dock weighted properly. Start with a grounded home value review and a strategy conversation.
Justin Ratowsky is a third-generation California Realtor® and a Huntington Beach local, and Craig Ratowsky has been selling here since 1977, which gives the team a long memory of how harbour pricing actually behaves across cycles. For a read on your specific situation, reach out through the contact page for a direct, no-pressure conversation.
Here is how Justin Ratowsky, Realtor®, Ratowsky Group at Compass, DRE #02026158 says it: "We treat you like family and your investment like our own."
For context, Median days on market across Ratowsky Group's closed transactions since joining Compass in 2019, a reminder that pace varies widely in thin-volume waterfront sales: ~11 days (source: Compass production dashboard, Ratowsky Group, since 2019).
Sources
Frequently asked questions
- How much do waterfront homes sell for in Huntington Harbour?
- Waterfront prices in Huntington Harbour span a wide band because a channel-front townhome, a dock home, and a point-lot estate are all technically waterfront. Any single average blends very different homes, so treat published ranges as illustrative and verify a specific home on its frontage, dock, and condition. Current ranges by island and home type are a better anchor than a single month.
- What premium do dock and waterfront homes command over inland homes?
- Waterfront and dock homes generally sell at a meaningful premium over comparable inland homes in the same ZIP code because water access, the dock, and the view cannot be reproduced on an inland lot. The exact premium depends on frontage, dock length, and demand at the time, so any percentage you see should be read as illustrative rather than a fixed multiplier. Thin supply tends to support the premium, while several waterfront listings at once can narrow it.
- How many waterfront homes sell per year in Huntington Beach?
- Huntington Harbour produces a limited number of waterfront closings each year, which is why the statistics can look volatile. With such a small sample, a single trophy sale or one discounted fixer can move a quarterly median noticeably. Looking at trailing twelve-month figures and segmenting by island gives a steadier picture than a single month.
- Why is price per square foot unreliable for waterfront homes?
- On the water, a large share of value sits in the dock, the frontage, the view, and the lot shape, none of which shows up in interior square footage. Two same-size homes can close at very different prices because one has wide frontage and a long dock and the other does not. Use price per foot as one input, then weight the land, frontage, and dock separately.
- Do waterfront homes in Huntington Harbour sell faster in summer?
- Orange County real estate tends to be busier in spring and early summer, and waterfront activity broadly follows that rhythm since the water shows best in warm, clear weather. Because waterfront volume is thin, though, the seasonal signal is easy to scramble with just one or two sales. A single quarter is rarely enough to confirm a pattern on so few transactions.
- What ZIP code is Huntington Harbour in?
- Huntington Harbour sits in the 92649 ZIP code in Huntington Beach, in coastal Orange County. The harbour spans several islands, including Trinidad, Davenport, Gilbert, Humboldt, and Admiralty, plus mainland water frontage. Sale statistics can vary noticeably from one island or home type to the next.
Topics
- best Huntington Beach realtor
- best Huntington Beach real estate agent
- Huntington Beach realtor
- Huntington Beach real estate agent
- Huntington Beach real estate broker
- Ratowsky Group
- Justin Ratowsky realtor
- Justin Ratowsky Huntington Beach realtor
- Compass Huntington Beach